We look forward to showing you Velaris, but first we'd like to know a little bit about you.


Metrics for Measuring Engagement in Customer Success
Understand the importance of product engagement metrics and how they can help Customer Success Managers boost retention and customer satisfaction.
The Velaris Team
November 22, 2024
As a Customer Success Manager (CSM), you’ve likely wondered: “Are users truly engaging with the product in a way that drives value?” or “Are we identifying product disengagement before it turns into churn?”
These are critical concerns. Product engagement is a direct indicator of how well your product fits user needs, how intuitive it is, and how often users return to use key features. Tracking the right product engagement metrics can uncover both your strongest value drivers and the friction points slowing down adoption.
By understanding how users interact with your product, you can take action to improve retention, boost satisfaction, and unlock growth. Here are some key product engagement metrics that reveal how well your product is serving users and where improvements can make the biggest impact.
1. Product Stickiness (DAU/MAU Ratio)
Product stickiness reflects how habit-forming your product is by showing how often monthly users return on a daily basis. It’s calculated as the DAU/MAU ratio.
To calculate product stickiness, count how many unique users actively used your product on a daily basis over a given month. This gives you the Daily Active Users (DAU). Then count how many unique users used your product at least once in the same month. This gives you the Monthly Active Users (MAU).
Finally, divide the DAU by the MAU, then multiply by 100 to express it as a percentage.
For example, a 25% stickiness rate means that on average, users are engaging with your product 1 in every 4 days. In B2B SaaS, where daily usage may not always be expected, a stickiness rate of 15–25% can still indicate strong engagement.
This metric helps identify whether your product has become a routine part of the customer’s workflow. A dip in stickiness may indicate confusion, loss of relevance, or product fatigue, prompting a review of UX design or onboarding support.
2. Feature adoption rate
Feature adoption measures the percentage of users adopting and using key features in your product. While it’s great if customers are logging in frequently, it’s even more important to know whether they’re utilizing the features that drive value.
For instance, if only 30% of users engage with a feature that’s central to your product's ROI, that’s a red flag. Low adoption may stem from poor feature discoverability, insufficient education, or a mismatch between product design and user needs.
This metric is a critical indicator of whether your customers are getting the full benefit of your product. By monitoring this metric, you can prioritize feature walkthroughs, tutorials, and in-product nudges to promote adoption and reinforce value delivery.
3. Product Usage Frequency
Usage frequency shows how often users return to your product within a given time frame (e.g., daily, weekly, monthly). Unlike stickiness, which is a ratio, frequency is more granular — tracking individual user patterns and fluctuations.
To calculate product usage frequency, start by selecting a specific time frame, such as a week or a month, and count how many times each user accesses your product during that period. Then, calculate the average number of sessions per user across your user base.
For example, if your users log in a total of 240 times in a week and you have 100 users, the average usage frequency is 2.4 sessions per user per week.
This metric helps identify power users, moderate users, and at-risk accounts. A sudden drop in usage frequency can signal dissatisfaction or workflow changes, making it a powerful early indicator of churn.
When used alongside segmentation (e.g., by account size or use case), it reveals which user groups are most engaged and which may need more support or training.
4. Conversion Rate
Conversion rate is the percentage of users who take a desired action — such as upgrading to a paid plan, inviting teammates, or completing a setup flow. It’s a critical metric for product-led growth, as it links engagement directly to business outcomes.
To calculate conversion rate, first define the specific action you consider a “conversion”, such as completing onboarding or upgrading to a paid plan. Then, count how many users completed that action during a set period. Divide this number by the total number of users who had the opportunity to convert (for example, all users who signed up), and multiply the result by 100 to get a percentage.
So, if 50 out of 200 new users activated a key feature, your conversion rate would be (50 ÷ 200) × 100 = 25%.
You could also use this calculator to check your conversion rate easily.
Tracking this metric helps you optimize onboarding, pricing, and in-product CTAs. For example, if many users sign up but few complete the setup flow, your onboarding process may need to be streamlined. By mapping where drop-offs occur, you can improve activation and drive higher long-term engagement and retention.
5. Session Duration

Session duration tracks how long users stay active during a single visit. While longer sessions can indicate deeper engagement, context is key — users spending too long on simple tasks may be struggling. Short session durations may point to shallow engagement or difficulty finding value.
This metric becomes more insightful when paired with page or feature-level data, showing where users spend their time and whether it aligns with intended product value.
Monitoring session duration over time can also reveal how improvements in UX or onboarding affect user behavior.
6. Retention Rate
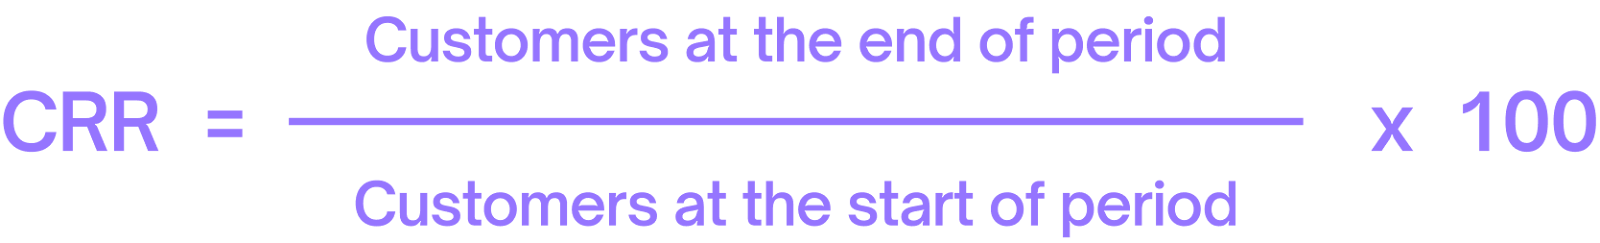
Retention rate measures how many users continue to engage with your product over time. It's a critical long-term engagement metric because it shows whether users return after their initial experience.
High retention typically means users are consistently finding value in your product. To calculate it, choose a specific time period (e.g., 30 days), and track the number of users who were active at the beginning of that period and are still active at the end. Divide the number of retained users by the original cohort size, then multiply by 100 to get the retention rate.
For example, if 200 users signed up and 80 are still active 30 days later, your 30-day retention rate is (80 ÷ 200) × 100 = 40%.
Improving this metric often involves better onboarding, support, and ongoing feature engagement.
7. Engaged User Rate
Engaged user rate reflects the percentage of users who perform key meaningful actions, such as completing workflows, creating content, or using a core feature, within a defined time frame.
It goes beyond basic login data to show whether users are interacting with your product in a valuable way.
To calculate it, identify what qualifies as meaningful engagement in your product, count how many users meet that threshold during your chosen time period, and divide that number by the total number of active users. Multiply by 100 for a percentage.
For instance, if 400 of your 1,000 users complete a workflow in a week, the engaged user rate is 40%. This metric helps prioritize efforts to boost real usage over superficial activity.
8. Net Promoter Score (NPS)

NPS is a well-known metric for gauging customer loyalty. It’s based on a simple survey question: “How likely are you to recommend our product to others?” Respondents answer on a scale of 0 to 10 and are grouped into Promoters (9–10), Passives (7–8), and Detractors (0–6).
To calculate NPS, subtract the percentage of Detractors from the percentage of Promoters. For example, if 60% are Promoters and 20% are Detractors, your NPS is 60 - 20 = +40.
While not a direct usage metric, NPS offers valuable insight into how users feel about your product, particularly when paired with actual behavior data like feature adoption or session duration.
9. Product Engagement Score
The product engagement score is a composite metric that gives you a single, high-level view of how actively users are interacting with your product.
It typically combines adoption, stickiness, and growth into one score, making it easy to benchmark engagement across user segments, accounts, or cohorts.
- Adoption Rate is the percentage of users using core features.
- Stickiness is calculated as DAU ÷ MAU (see earlier).
- Growth Rate is the change in active users over time.
A widely used method is to calculate the score using this formula:
Product Engagement Score = (Adoption Rate + Stickiness + Growth Rate) ÷ 3
Each metric is normalized as a percentage, and the final score gives you a 0–100 scale of overall engagement. For example, if your adoption rate is 60%, stickiness is 30%, and growth is 10%, the product engagement score would be (60 + 30 + 10) ÷ 3 = 33.3.
This score helps you quickly spot trends, compare performance across teams or time periods, and align product and CS teams on what success looks like.
10. Churn Rate

Churn rate measures the percentage of customers or users who stop using your product over a specific period. It’s a core metric for any subscription-based business and one of the clearest indicators of product disengagement.
A high churn rate usually points to unmet expectations, poor product fit, or usability issues — all of which stem from weak product engagement.
To calculate churn rate, take the number of users who stopped using the product during a set time period (e.g., a month), divide that by the number of users at the start of that period, and multiply by 100 to get a percentage.
For example, if you had 1,000 users at the beginning of the month and 100 churned, your churn rate is (100 ÷ 1,000) × 100 = 10%.
Tracking churn in parallel with feature usage, session trends, and feedback can help uncover why users leave — and what engaged users do differently. Reducing churn often requires improving onboarding, increasing product stickiness, and continuously reinforcing value throughout the customer journey.
How to act on user engagement data
Collecting user engagement metrics is just the first step. The real value comes when you act on this data to drive positive customer outcomes. Here’s how you can turn engagement insights into action:
1. Identify at-risk customers
A decline in usage or low engagement often signals that a customer is struggling or may not be seeing value in the product. By using engagement metrics to flag these users, you can intervene before they consider leaving.
Segment these customers and offer targeted interventions, such as personalized support or additional training.
If you’re using a Customer Success tool like Velaris, its customer health tracker and AI-powered sentiment analysis tool would be able to detect at-risk customers for you. This allows you to be one step ahead.
2. Improve customer onboarding and training
Successful onboarding is key to long-term user engagement. If customers don’t learn how to use your product effectively from the start, their engagement will drop.
Continuous education through webinars, documentation, and training materials ensures they keep learning and using more features over time.
3. Build stronger customer relationships through collaboration
Tracking engagement can highlight opportunities to deepen customer relationships with tailored communication and proactive support. Regular check-ins and personalized interactions go a long way in building loyalty.
4. Leverage engagement metrics to drive upsell opportunities
Highly engaged users are prime candidates for upselling or expansion opportunities. Look for power users who show significant usage growth and approach them with relevant offers.
However, simply acting on engagement data isn’t enough. It’s equally important to avoid common mistakes that can distort your insights or lead to ineffective strategies.
In the next section, we’ll explore some of the most common pitfalls when measuring user engagement metrics and how to avoid them.
Common pitfalls when measuring user engagement metrics
Once you start tracking user engagement metrics, it's important to avoid common pitfalls that can lead to misleading insights. Here are two mistakes to watch out for:
1. Focusing on vanity metrics
It’s easy to get distracted by metrics that look impressive but don’t necessarily reflect Customer Success. For example, tracking sheer login frequency may seem valuable, but it doesn’t tell you how deeply users are engaging with your product.
Instead, focus on metrics like feature adoption and time-to-value, which offer a clearer picture of how users are experiencing and benefiting from the product.
2. Failing to align metrics with customer outcomes
Another common mistake is tracking metrics that don’t tie back to your customers’ goals. For instance, measuring usage volume without connecting it to whether customers are meeting their objectives can result in wasted efforts.
To avoid this, ensure your metrics show how your product helps customers achieve their desired outcomes, like completing key milestones or reaching success with core features. By avoiding these pitfalls, you’ll be in a stronger position to act on your engagement data.
Conclusion
Tracking and acting on user engagement metrics is key to driving Customer Success. By focusing on meaningful data – such as feature adoption, time-to-value, and customer health – you can gain clear insights into how customers are interacting with your product and where they may need additional support.
Avoiding common pitfalls, like relying on vanity metrics or failing to align data with customer goals, will also help you make informed decisions that improve the overall customer experience. If managing these metrics feels challenging, Velaris can help.
With real-time tracking, automated workflows, and centralized communication, Velaris makes it easier to monitor engagement and take proactive steps to reduce churn and build stronger customer relationships. Book a demo today to see how Velaris can support your Customer Success efforts.
Frequently Asked Questions
The Velaris Team
A (our) team with years of experience in Customer Success have come together to redefine CS with Velaris. One platform, limitless Success.

Velaris is an AI-native Customer Success Platform built for mid-market and enterprise B2B SaaS teams. From customer health scoring and churn prediction to onboarding automation, renewals, and expansion workflows, Velaris helps recurring revenue teams understand account health, reduce churn, and scale customer success with greater visibility and control.