We look forward to showing you Velaris, but first we'd like to know a little bit about you.


How to Create a Customer Health Score Template That Works
Build a customer health score template to monitor customer well-being, identify risks, and support proactive success management.
The Velaris Team
March 12, 2026
A customer health score template is a ready-to-use framework that combines key metrics such as product usage, engagement activity, support interactions, customer feedback, and sentiment signals into a single score. This score helps Customer Success teams quickly identify which accounts are healthy, which require attention, and which may be ready for expansion opportunities.
This guide provides a plug-and-play customer health score template, explains the key metrics behind it, and explores how modern Customer Success platforms use AI to automatically calculate and update health scores based on real-time customer activity.
Key takeaways
- A health score template standardizes how customer risk and engagement are measured.
- Effective templates combine usage, engagement, support, and sentiment signals.
- Weighting metrics ensures the most important indicators influence scores.
- AI platforms automate health scoring by aggregating signals and updating scores in real time.
Example Customer Health Score Template
A customer health score template combines several key indicators into a single weighted score that reflects the overall status of an account. Each category represents a different dimension of the customer relationship, from product adoption to sentiment signals gathered through conversations and support interactions.
The following example shows a simple, practical health score model that many Customer Success teams can use as a starting point.
In this model, product usage carries the highest weight because consistent product adoption is typically the strongest indicator of customer success. Engagement and support metrics help identify how actively customers interact with the team and whether friction exists in the product experience. Customer feedback and sentiment signals add a qualitative layer that captures how customers feel about their experience.
Health score formula
Customer health scores are usually calculated using a weighted scoring formula:
Health Score = Σ (metric score × weight)
Each metric category is assigned a score, typically between 0 and 100, and multiplied by its corresponding weight. The weighted scores are then combined to generate the final health score for the account.
What is a Customer Health Score Template?
A customer health score template is a predefined scoring framework that combines multiple customer signals into a single metric that reflects the overall health of an account.
For Customer Success Managers, this score acts as a prioritization tool. Instead of manually reviewing dozens of signals such as product usage trends, engagement levels, support activity, and survey responses, the health score provides a clear snapshot of whether a customer is thriving, stable, or showing early signs of risk.
This standardized approach makes it easier to monitor large customer portfolios and identify accounts that require proactive intervention. Since reducing churn by just 5% can increase profits by 25–95%, early detection of customer risk signals is critical for sustainable growth.
What makes a health score template effective
An effective customer health score template relies on a few foundational principles that ensure the score is meaningful and actionable.
First, the template should include clearly defined metrics that reflect meaningful customer behaviors. Signals such as feature adoption, login activity, engagement with Customer Success teams, support ticket patterns, and customer feedback provide a well-rounded view of account health.
Second, the template should use a transparent weighting system. Each metric category should contribute to the overall score based on its importance to retention and expansion outcomes. For example, product adoption often carries more weight than occasional support interactions because it more directly reflects customer value.
Third, a health score template should use consistent scoring thresholds. Defined ranges like ‘healthy’, ‘monitor’, and ‘at-risk’, allow Customer Success teams to interpret scores quickly and take appropriate action.
Finally, the score should maintain a direct connection to customer outcomes. The metrics included in the template should correlate with real-world results such as retention, product adoption, and revenue expansion.
Key Metrics Included in a Customer Health Score Template
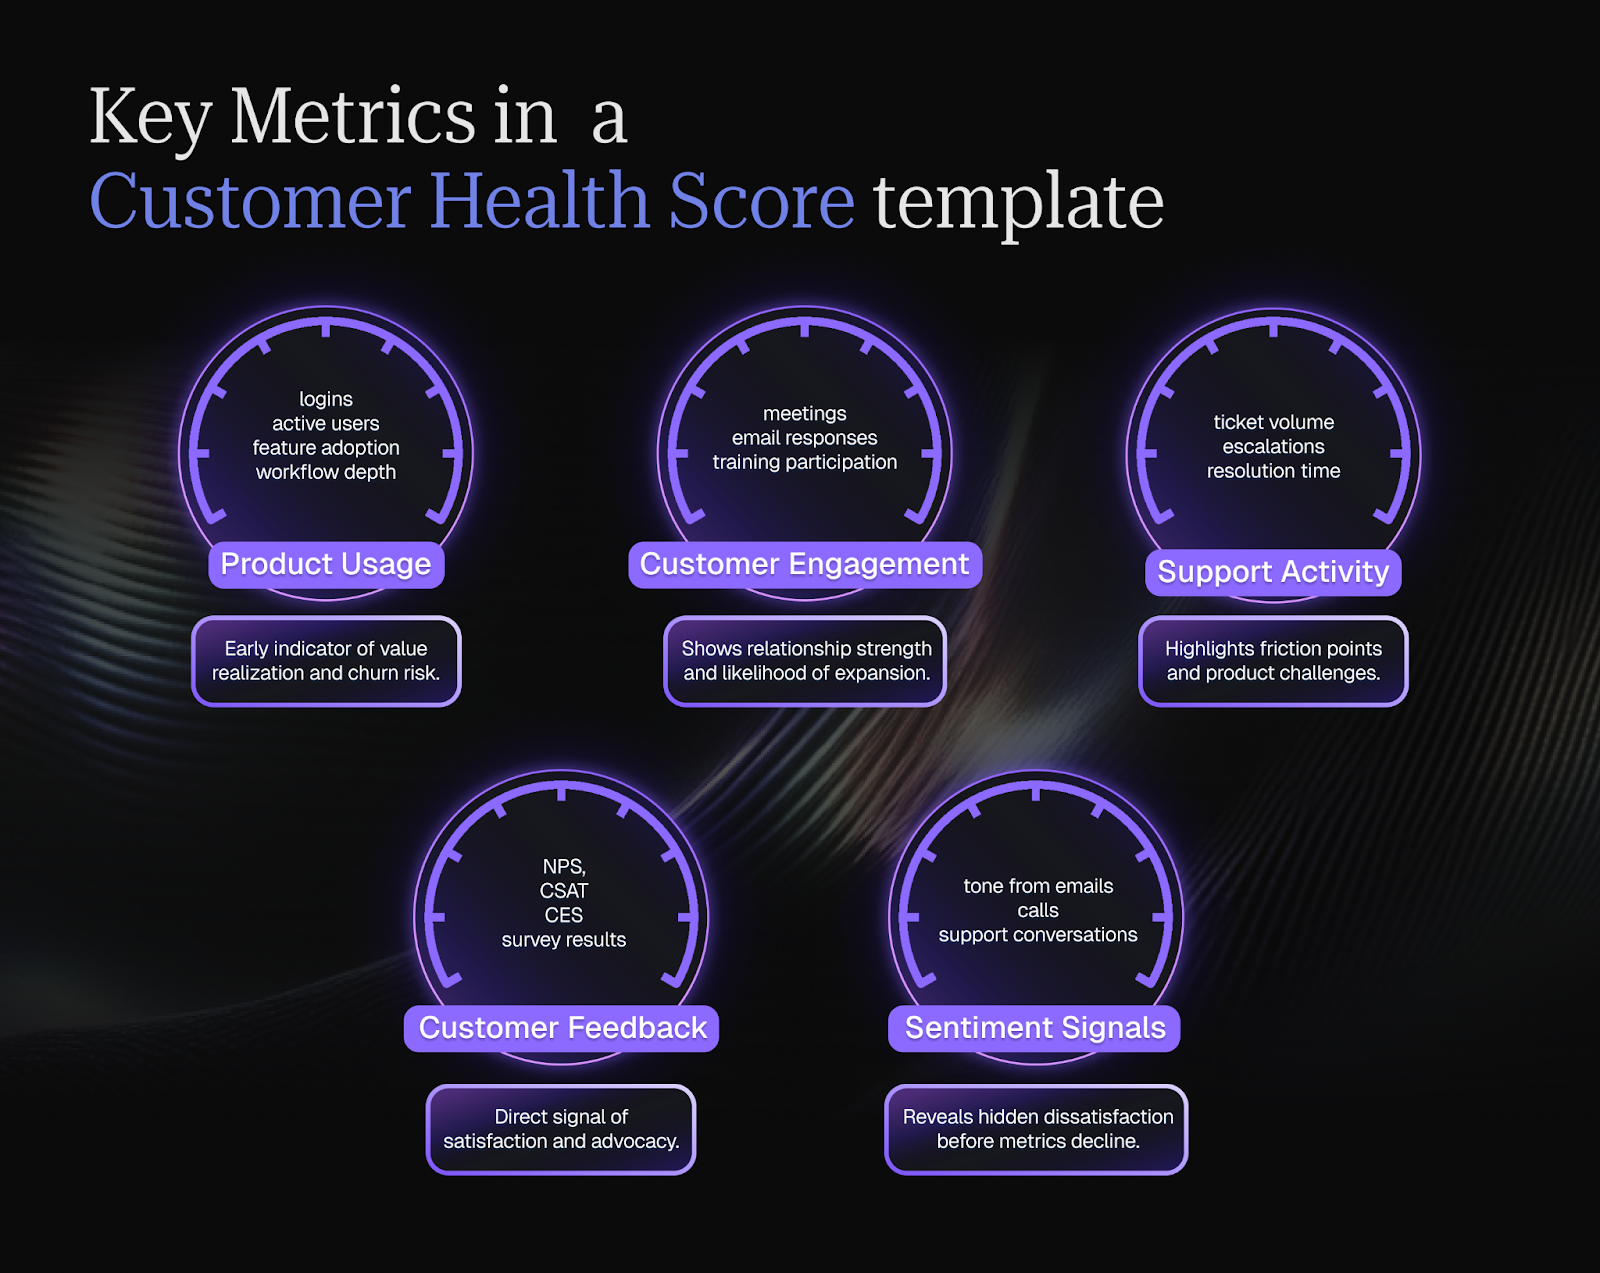
A strong customer health score template combines multiple signals that reflect how customers use the product, interact with your team, and perceive their experience. According to Union Square Consulting, effective customer health scoring models require varying signal categories including product usage, engagement metrics, financial indicators, and sentiment feedback to create a complete picture of account health.
The following metrics are commonly included in most customer health score templates.
Product usage signals
Product usage is often the most reliable indicator of customer health because it directly reflects whether customers are receiving value from the product. If customers consistently use key features and integrate the product into their workflows, they are more likely to remain engaged and renew.
Typical product usage metrics include login frequency, the number of active users within an account, feature adoption rates, and the depth of workflow usage across the platform. Many teams also track activation of core features that represent the primary value of the product.
When usage declines, like fewer logins or reduced feature adoption, it can signal that customers are struggling to realize value. These changes often appear before customers raise concerns, making usage metrics one of the earliest indicators of churn risk.
Customer engagement indicators
Engagement metrics measure how actively customers interact with Customer Success teams and educational resources. While product usage shows how customers use the platform, engagement signals reveal how connected customers are to the broader success program.
Examples of engagement indicators include meeting attendance, responsiveness to emails or outreach, participation in webinars or training sessions, and involvement in structured success plans. Some teams also track participation in user communities or product forums.
High engagement often correlates with stronger relationships and better product adoption. Customers who regularly attend check-ins, respond to communication, and participate in training are more likely to remain invested in the partnership and explore expansion opportunities.
Support interaction signals
Support activity can reveal friction points in the customer experience. While occasional support requests are expected, patterns in support interactions can provide important insight into potential issues.
Common support metrics include the number of support tickets submitted by an account, the frequency of escalations, average resolution time, and the types of issues being reported. Repeated issues related to the same feature or workflow may signal usability challenges or onboarding gaps.
A sudden spike in support volume often indicates that customers are encountering obstacles that prevent them from achieving their desired outcomes. Monitoring these patterns allows Customer Success teams to intervene early and address underlying problems.
Customer feedback metrics
Structured customer feedback provides direct insight into how customers perceive their experience with the product and support teams. Surveys allow organizations to collect consistent feedback that can be incorporated into health scoring models.
Common survey metrics include Net Promoter Score (NPS), which measures customer advocacy; Customer Satisfaction Score (CSAT), which reflects satisfaction with specific interactions; and Customer Effort Score (CES), which evaluates how easy it is for customers to accomplish tasks.
When survey scores decline, they often signal dissatisfaction even if product usage appears stable. Including feedback metrics in health scoring models helps teams identify customers who may be quietly losing confidence in the product or partnership.
Sentiment signals
Sentiment signals capture qualitative insights from customer conversations. While surveys provide structured feedback, sentiment analysis evaluates the tone of everyday interactions to uncover emotional signals that might otherwise be overlooked.
Examples include analyzing the tone of emails, evaluating call transcripts from customer meetings, assessing sentiment within support ticket conversations, and reviewing open-text comments from surveys.
These signals provide valuable context for understanding how customers truly feel about their experience. For example, a customer might maintain steady product usage while expressing frustration during support interactions. Sentiment analysis helps surface these hidden warning signs and ensures they are reflected in the health score.
Health Score Thresholds
Once health score metrics are defined and weighted, the next step is translating those scores into clear and actionable ranges. Thresholds help Customer Success teams quickly interpret what a health score actually means and determine the appropriate response for each account.
For a closer look at how to visualize these thresholds across your portfolio, see our guide to customer health dashboards and what effective health monitoring looks like in practice.
Without defined thresholds, a score such as 72 or 55 has little operational value. By grouping scores into categories, teams can immediately identify which customers are thriving, which require monitoring, and which need urgent attention.
Once the health score is calculated, it can be grouped into ranges that indicate the status of each account.
These thresholds allow Customer Success teams to prioritize their efforts quickly across large customer portfolios. Healthy accounts can be nurtured toward expansion, neutral accounts can be monitored for early warning signals, and at-risk customers can be escalated for immediate intervention.
Over time, organizations often refine these thresholds based on historical retention data. If analysis shows that churn frequently occurs below a certain score, teams can adjust ranges to improve risk detection and ensure that interventions happen early enough to make a difference.
Common Mistakes When Using a Health Score Template
Even well-designed health score templates can lose effectiveness if they are implemented incorrectly. Many Customer Success teams introduce scoring models with good intentions, but small design or operational mistakes can make the scores difficult to interpret or act on.
Understanding these common pitfalls helps ensure that health scores remain clear, reliable, and actionable.
Overcomplicating the model
One of the most frequent mistakes is including too many metrics in the scoring model. While it may seem beneficial to track every available signal, overly complex models often produce confusing results.
When a health score combines dozens of indicators, it becomes difficult for Customer Success teams to understand what is actually driving the score. A simpler model with a few meaningful metrics—such as usage, engagement, support activity, and feedback—often produces clearer insights and is easier to maintain over time.
Ignoring qualitative signals
Many health score templates focus primarily on quantitative data like product usage and login frequency. While these metrics are valuable, they do not always capture how customers truly feel about their experience.
Qualitative signals such as email tone, call conversations, and survey comments often reveal dissatisfaction before behavioral metrics change. Incorporating sentiment analysis or qualitative feedback helps ensure that early warning signs are not overlooked.
Using static weighting
The importance of different health signals changes throughout the customer lifecycle. During onboarding, engagement with training and setup milestones may matter more than feature adoption. Near renewal, usage depth and stakeholder sentiment may become stronger indicators of risk.
Using static weighting across all lifecycle stages can reduce the accuracy of the model. More mature scoring frameworks adjust metric weights depending on the customer’s stage in the lifecycle.
Not linking scores to action
A health score is only useful if it drives action. Some organizations calculate scores but fail to connect them to operational workflows.
Effective health score models trigger clear next steps. For example, a declining score might generate alerts for the Customer Success Manager, initiate a recovery playbook, or schedule proactive outreach. By linking scores to automated workflows, teams can respond quickly and consistently to changing customer conditions.
How AI Improves Customer Health Score Templates
Manual health score templates can work well when Customer Success teams manage a small number of accounts. However, as customer portfolios grow, maintaining these templates becomes increasingly difficult.
Data begins to live across multiple systems, signals change more frequently, and manually updating scores becomes time-consuming and error-prone.
AI-driven health scoring improves this process by continuously analyzing customer signals and updating scores automatically. Instead of relying on periodic manual reviews, AI systems evaluate customer data in real time and surface risk signals earlier.
According to Athenic, predictive health scoring could identify likely NPS detractors with 89% accuracy and flagged churn risk nearly a month earlier, enabling teams to intervene proactively. We can only assume that as AI develops, the effectiveness of predictive analysis will be even better in the near future.
AI-driven health scoring typically improves templates in several ways:
- Automatically aggregating data from multiple systems
AI can unify data from CRMs, product analytics platforms, support tools, and survey systems. This creates a single, continuously updated view of customer health without requiring manual data consolidation. - Detecting churn patterns earlier
Machine learning models can analyze historical customer behavior to identify patterns that commonly precede churn. By recognizing these patterns early, AI systems can flag at-risk accounts before problems become visible through traditional metrics. - Analyzing customer sentiment across conversations
AI-powered natural language processing can evaluate emails, call transcripts, and support tickets to detect tone and emotional signals. This helps identify dissatisfaction that may not yet appear in usage or engagement metrics. - Continuously recalibrating metric weightings
AI models can adapt health scoring logic as new data becomes available. If certain signals become stronger predictors of retention or churn, the model can adjust how heavily those signals influence the score. - Triggering proactive workflows when risk appears
When health scores decline or risk signals are detected, AI systems can automatically trigger alerts, tasks, or playbooks. This ensures Customer Success teams respond quickly to emerging issues instead of reacting after problems escalate.
For a broader look at platforms bringing these capabilities to CS teams, see our roundup of the top AI customer success tools and how they compare.
How Velaris Automates Customer Health Scoring
Velaris, a highly rated software on G2, helps Customer Success teams move beyond manual health score templates by automatically aggregating customer signals and updating health scores in real time. Instead of relying on static spreadsheets or periodic manual reviews, Velaris continuously evaluates customer activity across systems to maintain an accurate view of account health.
The platform integrates signals from multiple sources, including product usage data, CRM systems, support platforms, survey feedback, and customer communications.
By bringing these signals together into a unified health model, Customer Success teams can monitor engagement, satisfaction, and risk indicators from a single workspace.
Velaris also uses AI-driven capabilities to interpret customer signals and surface insights that may otherwise be difficult to detect.
Headlines automatically summarize important account developments by analyzing customer activity, conversations, and operational signals. This helps Customer Success Managers quickly understand what is happening within each account.
CallSense analyzes customer calls and meetings to identify sentiment, concerns, and key discussion topics. This allows teams to capture signals from conversations that may indicate shifting customer expectations or emerging issues.
AI Topics automatically detects recurring themes across emails, tickets, calls, and other customer interactions. By identifying patterns in communication, teams can uncover product friction, support challenges, or common customer requests.
AI Copilot assists Customer Success Managers by interpreting customer activity and highlighting potential risk signals. It helps connect different data points across systems and surfaces recommendations that support proactive account management.
Together, these capabilities allow Customer Success teams to monitor health scores across large customer portfolios while responding proactively when engagement patterns, sentiment signals, or usage behaviors begin to change.
Conclusion
A customer health score template provides a standardized way for Customer Success teams to evaluate customer engagement, satisfaction, and churn risk. By consolidating multiple signals into a single metric, teams can quickly understand which accounts are thriving, which require monitoring, and which may need immediate intervention.
As Customer Success operations scale, maintaining this model manually becomes more difficult. AI-powered platforms such as Velaris, a highly rated software on G2, help automate the process by aggregating data across systems, continuously updating health scores, and surfacing insights that enable proactive account management.
Book a demo to see how Velaris helps automate and maintain dynamic customer health scoring at scale.
Frequently Asked Questions
What should be included in a customer health score template?
A customer health score template should include product usage metrics, engagement signals, support activity, survey feedback, and sentiment indicators.
How do you assign weights in a customer health score?
Weights should reflect the importance of each signal to retention and expansion outcomes. Product usage often carries the highest weight.
What is a good customer health score range?
Many teams use ranges such as:
- 80–100 healthy
- 60–79 monitor
- below 60 at risk.
How often should health scores be updated?
Health scores should update continuously as customer behavior changes. AI-driven systems update scores automatically in real time.
Can AI improve a customer health score template?
Yes. AI can automatically unify customer data, analyze sentiment, detect churn patterns, and dynamically update health scores.
The Velaris Team
A (our) team with years of experience in Customer Success have come together to redefine CS with Velaris. One platform, limitless Success.

Velaris is an AI-native Customer Success Platform built for mid-market and enterprise B2B SaaS teams. From customer health scoring and churn prediction to onboarding automation, renewals, and expansion workflows, Velaris helps recurring revenue teams understand account health, reduce churn, and scale customer success with greater visibility and control.