We look forward to showing you Velaris, but first we'd like to know a little bit about you.


Churn Prediction Models: What They are and How to Build Them
Learn why and how to build a churn prediction model, necessary tools, implementation tips, and solutions.
The Velaris Team
January 28, 2026
A churn prediction model helps Customer Success teams identify at-risk customers early by analyzing patterns across product usage, engagement, sentiment, support activity, and commercial data. It prioritizes which accounts need attention, guides targeted interventions, and scales a CSM’s ability to manage growing portfolios, without replacing human judgement.
Key takeaways:
- Define churn clearly and select strong, validated risk indicators to ensure the model reflects real customer behaviour.
- Automate regular checks and alerts so CSMs are notified the moment a critical risk threshold is crossed.
- Integrate data from CRM, product analytics, support, and billing systems to create a unified, accurate foundation for predictions.
- Use platforms like Velaris to access built-in churn prediction capabilities, reducing the effort and complexity of building and maintaining your own model.
Why churn prediction matters for CSMs
Churn prediction models constantly monitor customer accounts by analyzing their behaviors and usage patterns.
Since they're trained on a large amount of customer data, they are able to spot deviations from a healthy baseline. This helps CSMs spot issues early leading to proactive action before the customer starts churning.
With a few additional steps that won't be discussed here, the models could also provide the CSMs with details of why a customer is churning. It highlights the specific risk indicators that were triggered, such as declining product usage, negative sentiment trends and low support engagement, rather than just providing a generic score.
This in turn allows CS teams to focus on accounts that need attention immediately. By ranking the entire customer base from highest risk to lowest, the model ensures that CSMs dedicate their limited time and resources to the accounts that are most likely to churn, maximizing the
impact of every intervention.
This focus matters because acquiring a new customer is 5 to 25 times more expensive than retaining an existing one, according to Harvard Business Review, making early intervention not just operationally efficient but financially critical.
What a churn prediction model is not
While churn prediction models are powerful tools for prioritizing resources and identifying risk, it is important to maintain realistic expectations about their capability.
They are not crystal balls, since churn prediction models calculate probability based on historical patterns and current data. They cannot perfectly foretell the future.
The model cannot account for sudden, unpredictable external events that may cause a customer to churn such as a company bankruptcy or a surprise acquisition by a competitor.
The score generated by a model is a powerful signal, but it is not the final decision-maker. CSMs hold valuable context of the customer relationship such as knowledge of internal political shifts within their organization, unlogged issues or personal relationships that affect the renewal.
Therefore even though these models point CSMs in the right direction, the final call should be up to the CSMs.
Before diving into model-building, G2's research is a useful starting point for understanding how businesses are already applying AI to predict and prevent churn at scale.
The data you need to build a churn prediction model
Here are types of data needed for a churn model:
Product usage trends
Product usage trends such as a drop in login frequency from 15 to 2 per week, the customer having never used a core feature like the 'Reporting Dashboard', or a severe usage decline.
Engagement and communication trends
Engagement and communication trends such as no CSM touchpoints in the last 45 days, a key stakeholder skipping the last two QBRs, or a noticeable decline in email replies and meeting attendance.
Support interactions
Support interactions such as a sudden spike from 3 to 18 tickets in a month, repeated reopened tickets, or a customer who has stopped logging tickets altogether despite ongoing issues.
Sentiment and qualitative signals
Sentiment and qualitative signals such as AI Pulse detecting negative sentiment in recent emails, an increase in themes like pricing concerns, or escalation language such as “this is blocking our workflow.”
Onboarding and adoption data
Onboarding and adoption data such as a customer who is stuck at 20% onboarding completion for three weeks, hasn’t completed key milestones like connecting integrations, or hasn’t reached first value within the expected timeline.
Renewal and contract data
Renewal and contract data such as a renewal due in 30 days with low product usage, an account with a recent downgrade, or a customer with procurement concerns noted in past renewal cycles.
How to build a churn prediction model
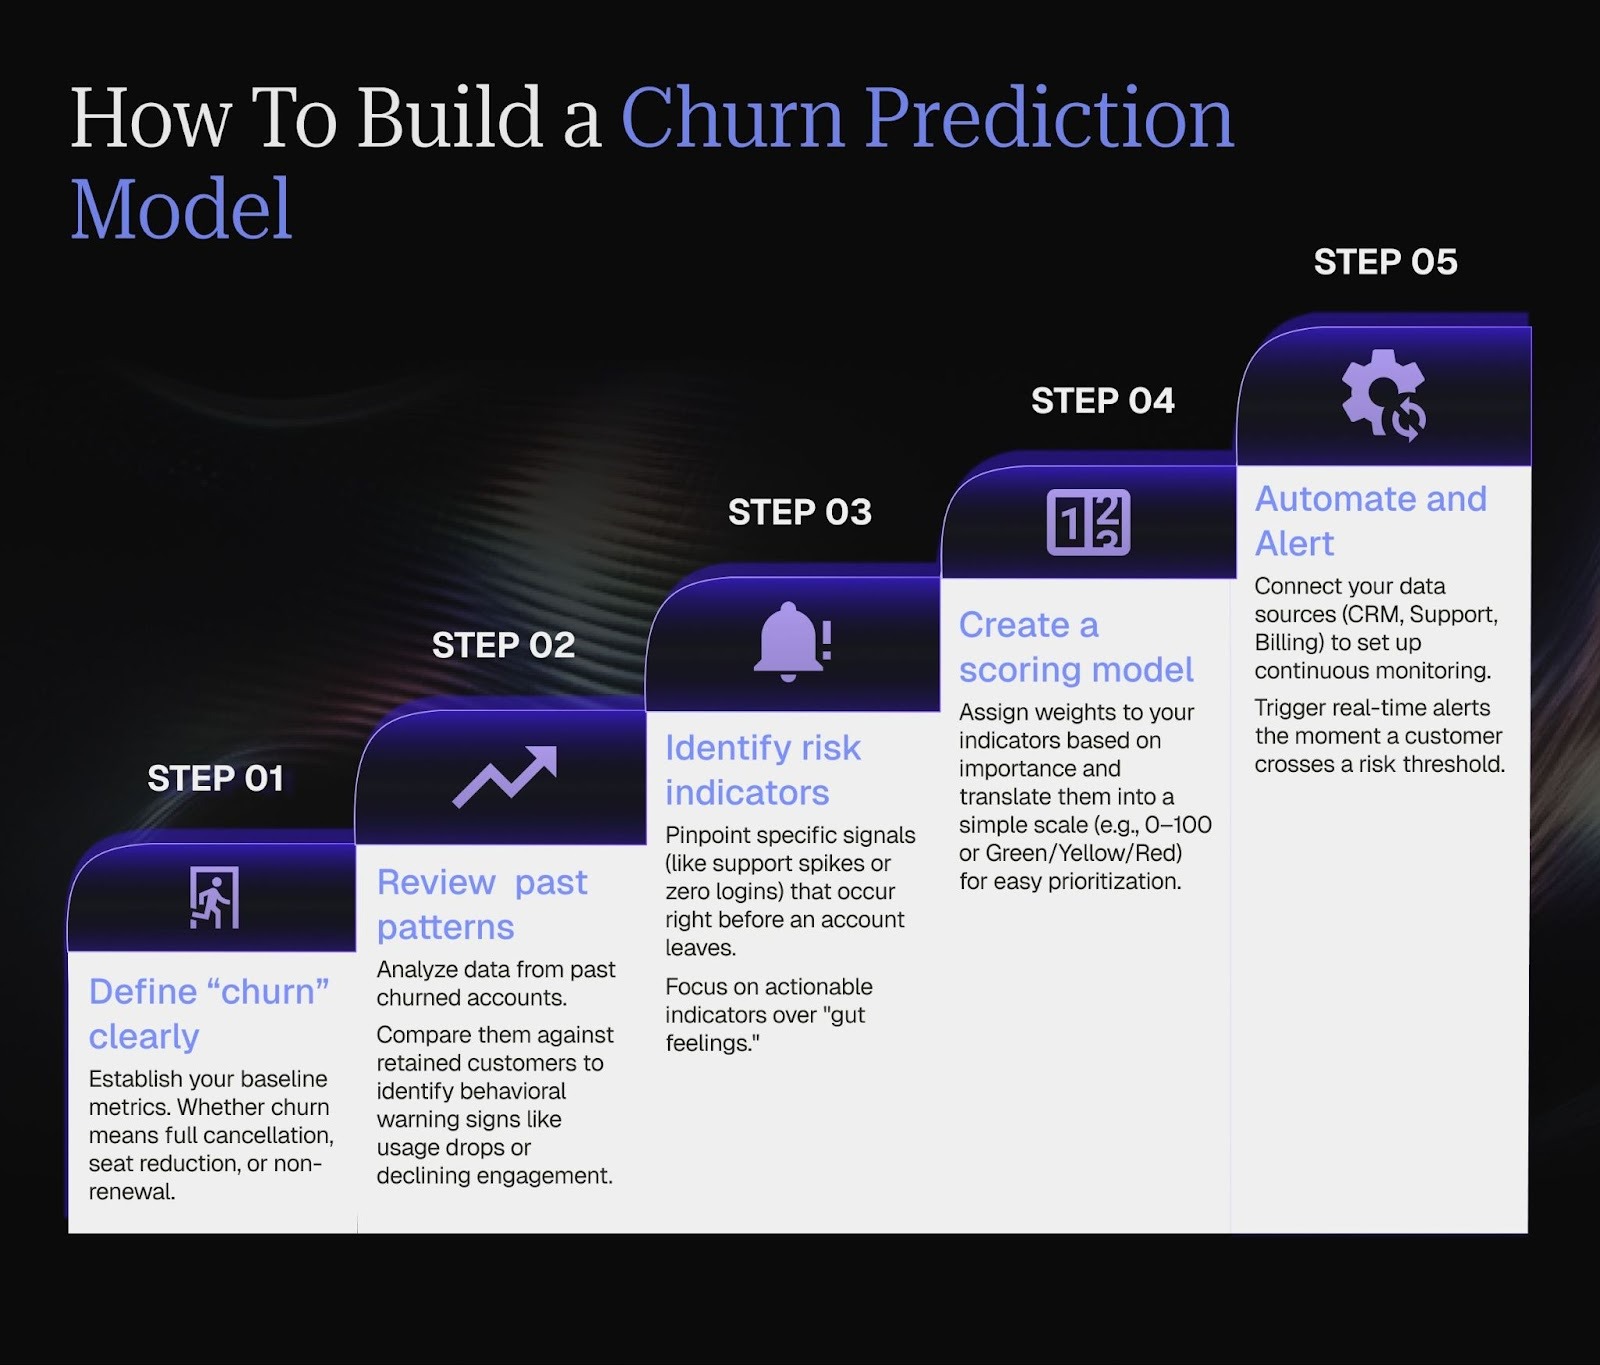
1. Define “churn” clearly
Since we are starting from scratch, we’ll need to clearly define the metrics for what churn really is, whether it is full cancellation, partial downgrade, reduction in seats, non-renewal or all of these.
It could also be useful if you include edge cases such as, How you treat trial or onboarding failures (did they “churn” or just never activate?). This is not really important at the start, but could be done later down the line.
2. Review patterns in past churned accounts
Once you have clearly defined churn, the next step is to analyze your historical data to understand what happened before accounts left. You can begin by actively comparing churned vs retained accounts of similar sizes and industries to precisely locate the behavioral differences that acted as warning signs.
Identify common patterns across the churned accounts, such as a noticeable usage drop, consistently negative sentiment captured in communication, or a prolonged period of low engagement.
3. Identify your strongest risk indicators
The next step after reviewing the patterns is to flagpoint the signals that appear right before churn such as no logins, support spikes, etc. Make sure to validate each of these with data and avoid gut-feel indicators.
Afterwards using this, categorize indicators into categories such as Product Usage, Engagement, Support, Sentiment, Onboarding and Commercial. Prioritize indicators that CSMs can take action on. Also remove noisy or unreliable indicators that do not add predictive value.
4. Create a simple scoring model (Green/Yellow/Red or 0–100)
In this step, we will be transforming the risk indicators into a usable health scoring scale. Begin by determining the relative importance of each indicator and assign weights to each chosen indicator accordingly (e.g: usage decline might be weighted 3 times higher than one missed QBR).
Next, create thresholds that translate the raw score into actionable statuses. For example you could use green for healthy usage and engaged stakeholders, yellow for early warning signals and slight behavioral declines, and red when multiple critical indicators have been triggered simultaneously.
To ensure accuracy, use historical data to tune the thresholds so that your model would have accurately predicted past churn events. It's vital to start simple, such as focusing on basic addition or a clear traffic light system, and avoiding the urge to over-engineer the first version.
Finally, validate the initial scoring model with CSMs to ensure the calculated health status accurately matches what they observe on the ground.
For a closer look at how to visualize and act on these scores, see our guide to customer health dashboards and what effective health monitoring looks like in practice.
5. Automate checks for these signals
To ensure your churn prediction model is always current and actionable, you must establish continuous data flow. You should set up daily or weekly automations to consistently check all risk factors such as usage, sentiment, support tickets, and engagement against your established thresholds.
It is crucial to trigger immediate alerts when specific thresholds are crossed, such as a sharp usage drop or the passing of a critical onboarding milestone. To make this possible, you should connect integrations so that data from all sources—support, product analytics, CRM, and billing systems, flows into one unified platform.
Tools you’ll need to build a churn prediction model
The right set of tools can make all the difference when building a churn prediction model. These tools range from data collection to model deployment, and each serves a unique purpose in the model-building process.
Here’s a simplified breakdown of the essential tools you'll need:
Data collection and integration tools
Customer Data Platforms such as Segment, Tealium, or Adobe Experience Platform are invaluable for corralling data from disparate sources into a single, coherent repository. This unified data view is critical for effective analysis.
Data preprocessing tools
Python libraries (pandas, NumPy) are the go-to for cleaning and transforming your data, tackling tasks like filling in missing values or standardising data formats.
Exploratory data analysis tools
Visualisation tools like Matplotlib, Seaborn, or Tableau and statistical tools in Python or R (like ggplot2) are crucial for understanding the intricacies of your data, helping identify patterns or anomalies that could inform your model.
Machine learning libraries
For the actual model building, libraries such as scikit-learn offer a wide range of algorithms and tools for preprocessing, model selection, and evaluation. For more complex models, TensorFlow/Keras or PyTorch provide deep learning frameworks that can uncover the nuanced patterns in customer behaviour.
Model deployment and monitoring tools
Docker and Kubernetes are essential for packaging your model and ensuring it runs smoothly in any environment. For serving models, frameworks like Flask or Django can help you create APIs to interact with your model.
Collaboration and version control
Collaboration tools like GitHub, GitLab, and Bitbucket are essential for managing code versions, collaborating with team members, and ensuring reproducibility.
Computational resources
Cloud Platforms such as Amazon Web Services (AWS), Google Cloud Platform (GCP), and Microsoft Azure provide scalable compute and storage resources, making it easier to train large models and handle extensive datasets.
We understand that the prospect of building a churn prediction model may seem difficult at first glance. Dealing with different datasets, selecting the right libraries and frameworks, and eventually deploying your model can all feel a bit overwhelming.
But, it's all about taking that initial leap. As you start working on these tools, you'll slowly get a hang of things and may even become comfortable with the manual maintenance tasks.
What if teams can’t afford to develop a custom churn prediction model?
Building and managing an internal churn prediction model might not be feasible for all organizations due to the substantial amount of time taken, and the large cost of maintenance that comes along with it.
For teams lacking dedicated data science resources to work these models, Customer Success platforms like Velaris offer an automated solution. These platforms have built-in churn prediction capabilities that remove the additional burden placed on your organization.
How to use churn predictions in daily workflows
For a churn prediction model to deliver value, its output must be consistently integrated into the CSM's routine. Here are some ways that CSMs can use churn predictions in their daily workflows:
Weekly “Top Risk Accounts” review
CSMs should establish a routine, starting the week with a weekly "Top Risk Accounts" review. This structured process involves reviewing all accounts flagged as Red or Yellow by the prediction model. This process allows CSMs to prioritize high risk accounts and to make sure that resources are being allocated efficiently.
Creating targeted playbooks for each risk type
Since not all risks are the same, the action you take must match the problem. Your team needs to focus on creating specific, targeted action plans or playbooks, for each type of risk the model finds.
For example, you'd use one playbook for a "Product Adoption Risk" (where the customer isn't using the product enough) and a different one for a "Support Frustration Risk" (where they're unhappy with service). This makes sure the CSM's response is relevant and effective, which is the fastest way to fix the issue.
Tracking outcomes and improving the model continuously
The final step is to close the loop: CSMs must consistently log the outcome of their interventions. This continuous feedback loop involves tracking outcomes and improving the model continuously. This data feeds back into the system, allowing the model to be retrained and refined over time, making future predictions smarter and more accurate.
Common mistakes CSMs make with churn prediction
Only looking at product usage
A common error is believing that product usage alone tells the whole story. While usage is critical, it is only one data point.
Ignoring factors like support interactions, financial data (e.g., billing issues), or qualitative feedback leads to a massive blind spot where a customer can appear technically healthy but be deeply dissatisfied and ready to leave due to poor service or an unhappy champion.
Treating a score as a final truth
Treating the model's score as a final, absolute truth is a mistake as the prediction model provides a probability, not a certainty. The score is a signal that requires the judgement of a CSM, and understanding of the relationship's unique context. Therefore a CSM should always validate the signals and determine the right course of action.
Ignoring qualitative signals
Since customer behaviour and product evolve, model inputs should evolve with that.
Forgetting to update risk indicators means your model can become obsolete. If a key feature is retired or your ideal customer profile changes, the old indicators may become irrelevant, leading to inaccurate predictions over time.
Not linking predictions to playbooks
The biggest mistake is having a prediction that doesn't lead to a clear plan. If a high-risk score doesn't immediately set off a specific playbook, that score is useless. Every status, whether Red or Yellow, must be connected to a documented response that clearly tells the CSM exactly what steps to take right now to contact the customer and fix the problem.
Conclusion
Churn prediction models are tools that give Customer Success teams the structure, clear view, and ability to handle more customers needed to protect revenue in a way that intuition alone cannot.
By looking closely at patterns in things like how often the product is used, how engaged the customer is, what their mood is, how much support they need, and their contract details, these models spot danger early. This helps CSMs take meaningful action to keep the customer before they decide to leave.
But the real value comes from how teams use these insights. When predictions are tied to weekly workflows, targeted playbooks, and continuous feedback loops, they enable CSMs to focus their time where it matters most and improve outcomes across their entire portfolio.
Whether built internally or accessed through platforms like Velaris, churn prediction models are becoming an essential part of a modern Customer Success organisation. They don’t replace human judgement, they strengthen it, giving teams the confidence and clarity to act proactively, personalise interventions, and ultimately drive healthier, longer-lasting customer relationships.
Book a demo today to see how Velaris (4.7 stars on G2) helps you prioritize high-risk accounts, automate alerts, and use data to guide every customer conversation.
Frequently Asked Questions
1. How does a churn prediction model actually identify customers at risk?
It compares current customer behaviour, such as product usage, engagement, sentiment, support activity, and contract signals, to patterns found in past churned accounts. When it detects deviations from a healthy baseline, it assigns a risk score or classification.
2. Can a churn prediction model tell us why a customer is likely to churn?
It depends. While a churn prediction model can provide a risk score, the reasons behind it are not always straightforward. Some models can highlight specific risk indicators, such as declining usage, negative sentiment trends, missed onboarding milestones, or support frustration.
However, the depth of insights may vary depending on the model and the data it analyzes. CSMs may still need to dig deeper into individual customer behaviors and context to fully understand the root cause.
3. How is this different from relying on CSM intuition?
Intuition varies widely between CSMs, one might label accounts as risky too quickly, while another may miss early signals. And intuition only scales to about 10–20 accounts. Once a portfolio grows to 50 or 100+, no CSM can manually track every usage drop, support spike, or stakeholder change. Churn prediction models bring consistency and scale to this process.
4. What kind of data do we need to build a reliable churn prediction model?
You’ll need data across multiple categories:
- Product usage trends
- Engagement and communication patterns
- Support interactions
- Sentiment and qualitative signals
- Onboarding and adoption progress
- Renewal and contract details
Models are more accurate when these datasets are unified and consistently updated.
5: How do I ensure accurate churn predictions?
To ensure accurate predictions, you need to integrate reliable data from various sources like CRM, support, product usage, and billing systems.
Velaris simplifies this by automatically syncing and centralizing data from all relevant touchpoints. With real-time data integration, your churn prediction model will reflect up-to-date customer behaviors, increasing the accuracy of the predictions.
The Velaris Team
A (our) team with years of experience in Customer Success have come together to redefine CS with Velaris. One platform, limitless Success.

Velaris is an AI-native Customer Success Platform built for mid-market and enterprise B2B SaaS teams. From customer health scoring and churn prediction to onboarding automation, renewals, and expansion workflows, Velaris helps recurring revenue teams understand account health, reduce churn, and scale customer success with greater visibility and control.