We look forward to showing you Velaris, but first we'd like to know a little bit about you.


Customer Success Reporting: The Full Guide
Unlocking the secrets hidden within customer data isn't just a strategy—it's a game-changer. From dedicated Customer Success Managers to essential stakeholders, this guide serves as your practical roadmap. Delve into the realm of insightful reporting, where the compilation and presentation of reports become pivotal in driving informed action.
The Velaris Team
July 17, 2026
Customer Success Reporting is the backbone of SaaS growth. It turns raw customer data into actionable insights, helping teams track health, usage, and outcomes. By surfacing risks, reducing churn, and highlighting expansion opportunities, it ensures Customer Success Managers and stakeholders know exactly how to deliver value.
Key takeaways
- Clear, actionable reports reduce churn, improve retention, and link directly to revenue outcomes.
- Focus on the right metrics such as Health scores, NPS, CSAT, churn/renewal rates, expansion revenue, GRR, and NRR which provides a complete view of customer health and business impact.
- Clean layouts, simple visualizations (charts, graphs, heat maps), and compelling narratives make reports easy to understand and decision‑driving.
- Issues like data isolation, integration gaps, time constraints, and overwhelming volumes are minimized with automation, clear KPIs, and intuitive platforms.
- Predictive analytics for churn, evolving KPIs, and continuous improvement cycles ensure reporting stays relevant and aligned with business goals.
What is customer success reporting
Customer success reporting tracks customer data to measure adoption, engagement, and health. Unlike support reporting, which focuses on issue resolution, success reporting highlights long‑term outcomes like retention, satisfaction, and growth across the customer lifecycle.
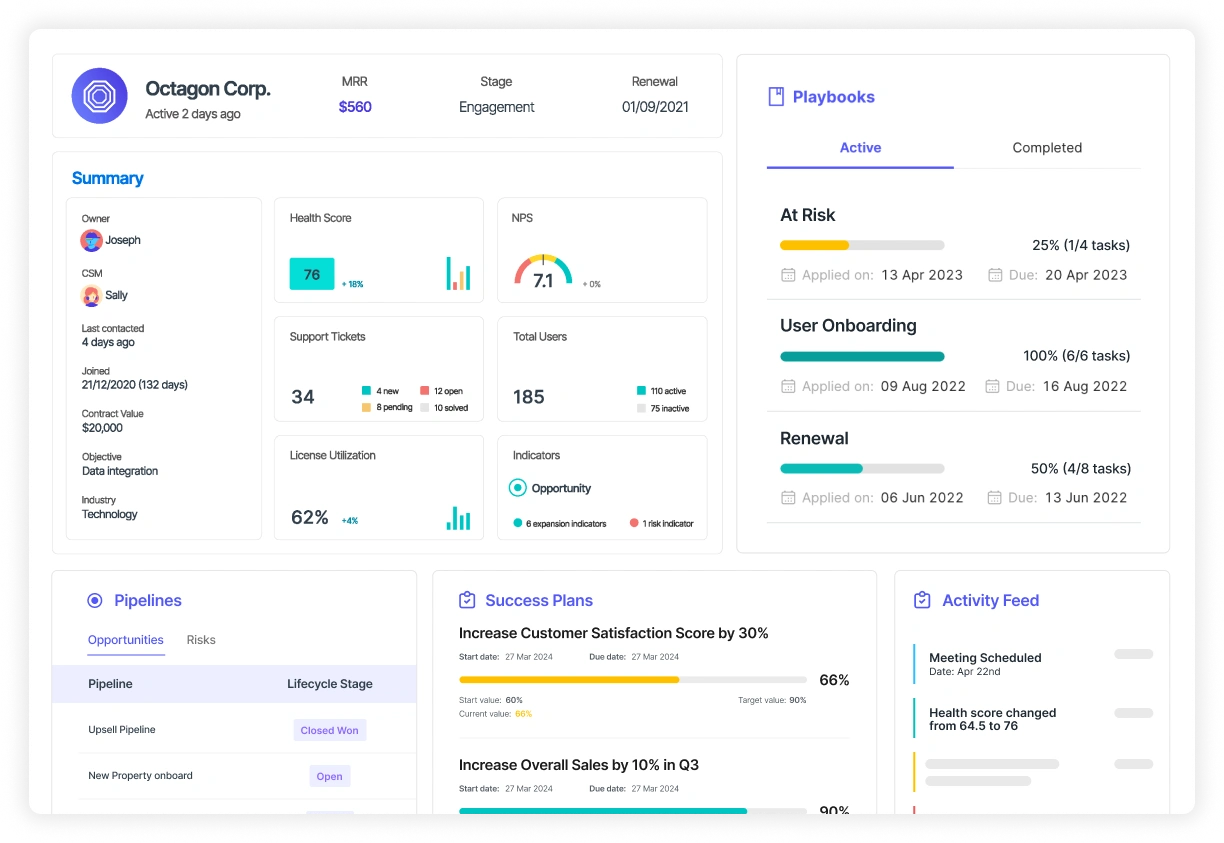
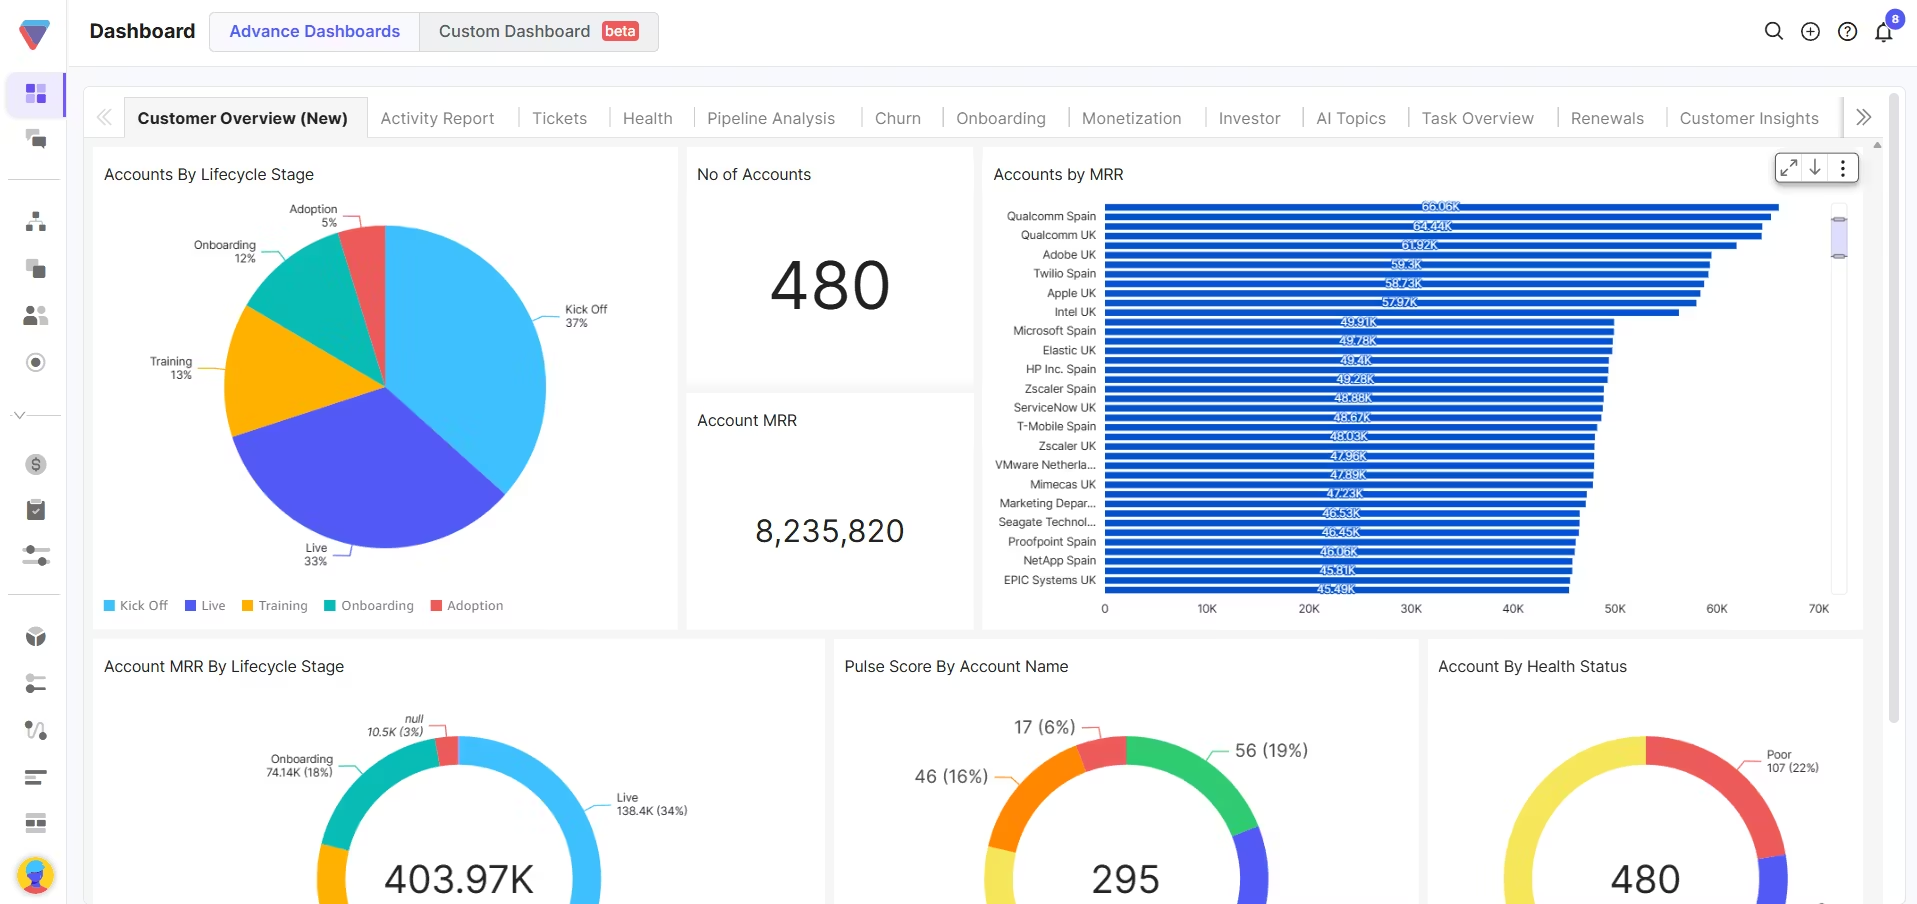
Platforms like Velaris make this easier by centralizing data and offering dashboards for health scores, usage, and engagement, helping teams spot risks and align reporting with business goals.
Why customer success reporting is important
Customer success reporting is important in SaaS because it shows how customers use the product and whether they are satisfied. By tracking customer health, usage, and engagement, teams can spot problems early, keep customers longer, and find chances to grow through upsells.
The numbers explain why this matters:
- In 2025, the average SaaS churn rate is 4.1% per year.
- A small 5% increase in retention can raise profits by up to 95%.
- Keeping existing customers costs five times less than finding new ones.
- Current customers spend 67% more than new ones.
Reporting also builds trust inside the company. When data is clear, executives, product teams, and customer success managers can make smarter decisions together. With SaaS expected to reach $418.2 billion in the U.S. by 2034, businesses that use reporting well will cut churn, grow faster, and stay ahead of competitors.
What makes customer success reports effective
Customer success reports are only valuable when they turn data into clear, reliable insights that guide action. Effective reporting ensures accuracy, drives decisions, and stays aligned with business goals helping teams improve retention, growth, and overall customer outcomes.
Accuracy and consistency in data
Customer success reports are only effective when the data is accurate and consistent. Reliable numbers on customer health, usage, and engagement give teams confidence in the insights. Without trustworthy data, reports lose value and decisions become risky.
Actionability: reports should drive decisions
Good reports guide action by highlighting churn risks, adoption gaps, or upsell opportunities, customer success reports help teams take clear steps that improve retention and growth. Actionable insights turn reporting into a tool for real outcomes.
Alignment with business goals
Reports are most powerful when they connect directly to business objectives. Whether the goal is reducing churn, increasing revenue, or improving product adoption, customer success reporting ensures stakeholders see how customer success drives overall company performance.
Balance in leading and lagging indicators
Lagging indicators, such as churn, renewal rate, and expansion revenue, show what has already happened. Leading indicators help teams act earlier by tracking signals such as falling product usage, missed milestones, declining engagement, or changes in sentiment.
An effective report should include both. Use leading indicators to identify accounts that need attention now, then use lagging outcomes to judge whether the intervention worked.
What kinds of reports do you need for customer success?
Different teams need different views of customer data. A report that helps a CSM decide which account to contact today will not give an executive the clarity they need on revenue risk.
A genuinely useful report starts with the decision each audience needs to make, then includes only the metrics that support it.
Reports for individual CSMs
CSMs need account-level and portfolio-level reports that help them prioritise daily work. These should show which customers need attention, why they are at risk, and what action is due next.
Useful reports include:
- Portfolio health report: Health status across the CSM’s book of business, including recent score changes
- Risk and intervention report: Accounts with declining usage, negative sentiment, support escalation, or weak stakeholder engagement
- Renewal pipeline report: Upcoming renewals, forecast category, open risks, and next steps
- Onboarding and adoption report: Delayed milestones, time-to-value, and customers failing to adopt important features
- Task and follow-up report: Overdue actions, unresolved commitments, and playbooks currently in progress
The report should make the next action obvious. CSMs should not have to search through several dashboards to understand why an account was flagged.
Reports for Heads of Customer Success
Heads of customer success need a wider view of portfolio performance and team execution. Their reports should reveal where risk is concentrated, whether forecasts are reliable, and how effectively CSM capacity is being used.
Useful reports include:
- Overall portfolio health report: Distribution of healthy, watchlist, and high-risk accounts
- Retention and expansion report: GRR, NRR, churned revenue, contraction, and expansion by segment
- Renewal forecast report: Forecasted renewals compared with actual outcomes
- CSM performance report: Portfolio size, risk coverage, task completion, forecast accuracy, and customer outcomes
- Capacity report: Accounts and recurring revenue per CSM, adjusted for customer complexity and service model
- Playbook effectiveness report: Which interventions are being used and whether they improve adoption, health, or renewal outcomes
CSM performance should not be judged by activity volume alone. Calls completed or emails sent are less useful than whether risk was resolved and customer outcomes improved.
Reports for product teams
Product teams need reports that connect customer feedback with actual product behaviour. The aim is to understand where users experience friction and which issues affect retention or expansion.
Useful reports include:
- Feature adoption report: Usage of core features by customer segment and lifecycle stage
- Journey and drop-off report: Where users abandon onboarding or important workflows
- Sentiment and feedback report: Recurring themes across calls, tickets, surveys, and emails
- Feature request report: Volume, affected accounts, commercial value, and urgency of requests
- Product-risk report: Accounts where low adoption or product friction is contributing to churn risk
These reports become more useful when usage and feedback are viewed together. A feature may have low adoption because customers do not need it, cannot find it, or encounter friction when trying to use it.
Reports for support and operations teams
Support and CS operations teams need reports that show how service delivery affects account health. This helps them identify repeated problems and improve the systems behind the customer experience.
Useful reports include:
- Escalation report: High-severity issues and the accounts affected
- Recurring issue report: Common ticket themes, reopen rates, and unresolved product problems
- Service-level report: Response and resolution performance for different customer segments
- Data-quality report: Missing account fields, integration failures, and inconsistent health-score inputs
- Workflow report: Playbook completion, automation errors, and operational bottlenecks
These reports help teams distinguish between isolated incidents and systemic problems affecting several customers.
Reports for the C-suite and board
Executives need a concise commercial view of customer success. Reporting should show how the customer base is affecting recurring revenue, where material risk sits, and what action leadership needs to take.
Useful reports include:
- Retention report: GRR, NRR, logo retention, and churned revenue
- Renewal risk report: At-risk recurring revenue and major accounts approaching renewal
- Expansion report: Revenue generated from existing customers and the current opportunity pipeline
- Segment performance report: Retention and growth by customer size, industry, region, or product
- Forecast report: Expected renewal and expansion outcomes compared with targets
- Strategic risk report: Major product, service, or relationship issues affecting future revenue
Executive reports should focus on movement and implications. Rather than showing only that NRR is 103%, explain how it changed, what drove the movement, and which risks could affect the next reporting period.
Build one reporting system with different views
These reports should not be created from separate definitions or disconnected datasets. Account-level signals used by CSMs should roll up into team performance, portfolio trends, and executive revenue reporting.
Using consistent definitions for health, risk, churn, and expansion prevents teams from debating the numbers instead of acting on them. The audience and level of detail may change, but the underlying source of truth should remain the same.
Key metrics to track in customer success
Customer success reporting is most effective when it focuses on the right metrics. These measures give teams a clear view of customer health, satisfaction, and revenue impact, helping them reduce churn, improve retention, and drive growth.
Reporting anti-patterns to avoid
Some customer success metrics look positive without showing whether customers are receiving value or likely to renew. Reports should prioritise signals that explain outcomes, not activity counts that are easy to inflate.
Reporting raw login numbers
A high login count does not always mean the customer is adopting the product successfully. Users may be logging in repeatedly because a workflow is confusing or a task takes too long.
Replace raw logins with measures such as active feature adoption, completed workflows, time-to-value, and usage of the capabilities linked to the customer’s goals.
Treating ticket volume as a health signal
A large number of support tickets can indicate frustration, but it can also reflect strong engagement. A low number may simply mean customers have stopped asking for help.
Track ticket severity, reopen rates, resolution time, recurring themes, and sentiment instead. These metrics provide more context about whether support activity represents healthy engagement or unresolved risk.
Averaging away important risks
Portfolio averages can make performance look stable while weaker segments are deteriorating. A healthy overall retention rate may hide high churn among new customers or a specific product tier.
Break metrics down by segment, lifecycle stage, contract value, and cohort. This makes it easier to see where risk is concentrated and where intervention will have the greatest impact.
Measuring activity instead of outcomes
The number of calls, emails, and QBRs completed shows how busy the team is, not whether the work improved customer outcomes.
Connect CSM activity to changes in adoption, health, renewal confidence, expansion, or risk resolution. A report should show what changed because of the interaction, not simply that the interaction happened.
Tools and platforms for customer success reporting
CRM systems
CRM systems like Salesforce and HubSpot are widely used to manage customer data and track interactions. They provide strong sales and pipeline reporting, but they often lack the specialized reports customer success teams need because CRMs were originally built for sales, not for ongoing customer health. This is where Customer Success Platforms (CSPs) stand out, offering deeper insights into retention, adoption, and expansion.
Analytics tools
Analytics platforms such as Tableau and Power BI allow teams to build custom dashboards and visualize customer success data. They are flexible and powerful for combining multiple data sources, but they require more setup and technical expertise. Their strength lies in turning raw data into clear, visual insights that executives and stakeholders can easily understand.
Use LLM tools for on-demand reporting
Tools such as ChatGPT and Claude can analyse customer data from uploaded spreadsheets or connected business systems. CSMs can ask questions in natural language to identify at-risk renewals, compare account health, summarise portfolio changes, or investigate drops in product usage.
LLMs can then turn the findings into tables and charts, and even draft reports. Their accuracy still depends on clean data and properly configured access, so important calculations and conclusions should be reviewed before sharing.
Dedicated AI tools for customer success reporting
Traditional customer success platforms provide dashboards for tracking health, adoption, renewals, and team performance. They centralise CS data effectively, but reports often depend on preconfigured widgets and rules that require ongoing setup. The modern solution is AI tools for customer success.
AI-native platforms such as Velaris make reporting more flexible. CSMs can ask Copilot questions in natural language and create on-demand dashboards from live customer data. These dashboards can then be opened in a collaborative workspace and shared through a link with colleagues and customers alike.
Anatomy of a customer success report
A strong customer success report should answer three questions quickly: what changed, why it matters, and what needs to happen next. Its structure should reflect the decisions the audience needs to make rather than simply presenting every available metric.
Start with the reporting context
Open with the reporting period, intended audience, and scope. Make it clear whether the report covers one account, a CSM portfolio, a customer segment, or the entire business.
Include the main objective too. A renewal report may focus on revenue risk, while an onboarding report should prioritise progress, delays, and time-to-value.
Lead with an executive summary
The first section should summarise the most important developments. Highlight major wins, emerging risks, meaningful changes, and decisions that require attention.
Keep this brief. Senior readers should be able to understand the overall position without reviewing every chart or account-level detail.
Organise the report around customer outcomes
The body of the report should cover the areas most relevant to the customer lifecycle and commercial goals:
- Onboarding and engagement: Progress towards milestones, adoption trends, and delayed accounts
- Health and risk: Changes in health scores, sentiment, stakeholder engagement, and support activity
- Renewals and churn: Upcoming renewals, at-risk revenue, forecast changes, and reasons for risk
- Expansion: Increased usage, new use cases, and qualified growth opportunities
- Advocacy: Referrals, reviews, customer stories, and reference activity
Only include sections that support the report’s purpose. A weekly CSM report will need more account detail, while an executive report should focus on portfolio movement and revenue impact.
Use visuals that explain the data
Choose each visual based on the question it needs to answer. Trend lines work well for changes over time. Other examples of effective dashboard design include heat maps that make risk concentration easy to spot, and bar charts that help compare segments or revenue outcomes.
Avoid adding charts simply to make the report look complete. Every visual should reveal a pattern, comparison, or change that would be harder to understand from a raw table.
Explain what changed and why
Metrics need interpretation. Instead of stating that adoption fell by 10%, explain which customers were affected, what caused the decline, and whether it creates renewal risk.
A clear narrative helps readers distinguish between normal variation and a development that needs action. It also prevents stakeholders from drawing different conclusions from the same data.
End with actions and ownership
Close the report with a short list of priorities. Each action should include an owner, deadline, and expected outcome.
This turns the report into an operating tool rather than a static summary. The next reporting cycle should review whether those actions were completed and whether they improved the underlying result.
Keep the layout clear and focused
Use consistent metric definitions, simple labels, and a clear visual hierarchy. Put the most important insights near the top and move supporting detail into later sections or appendices.
A useful report does not contain the most data. It makes the most important information easy to understand and act on.
Common challenges in customer success reporting and how to solve them
Customer success reporting often faces hurdles that reduce accuracy and impact. The most common challenges include:
- When data is isolated, reports become fragmented. Seamless integration across systems ensures a complete view of the customer journey.
- Too much detail overwhelms stakeholders, while too little hides risks. The fix is to focus on KPIs that directly tie to retention, adoption, and growth.
- Prioritizing key metrics and using dashboards with clear visualizations helps cut through the noise when there is a lot of data available.
- Automating data pulls and using platforms that unify reporting reduces mistakes and saves time.
- Building meaningful reports takes effort and can distract from customer engagement. Templates and CSPs streamline reporting so teams can focus on outcomes.
- Complex analytics tools require advanced skills. Intuitive platforms lower the learning curve and make insights accessible to everyone.
- Industry benchmarks and KPIs change quickly. Regularly reviewing and updating dashboards keeps reports relevant.
Utilizing a customer success platform (CSP) helps minimize most of these hurdles. Platforms like Velaris offer an intuitive interface that centralizes data, simplifies visualization, and streamlines reporting. This allows teams to navigate large volumes of information without overwhelm, close integration gaps, and focus on delivering exceptional outcomes.
With Velaris Copilot, teams can describe the report or dashboard they need in natural language. Copilot can then build the view on demand and surface the most important trends or risks. Once created, the report can be shared in a single click with colleagues or customers.
Best practices for aligning reporting with business goals
To align customer success reporting with business goals, focus on metrics that connect directly to revenue outcomes. Track KPIs like churn rate, expansion revenue, and product adoption to show how customer success drives growth.
Link customer success metrics to revenue outcomes
Choose metrics that show a clear connection between customer behaviour and commercial performance. Churn rate, gross revenue retention, net revenue retention, expansion revenue, and renewal forecast accuracy all help demonstrate how customer success protects and grows recurring revenue.
Product adoption and engagement metrics are also useful, but they need context. Rather than reporting that feature usage increased, explain whether the change improved onboarding, reduced risk, or created an expansion opportunity. This keeps the report focused on business impact instead of activity alone.
Tailor reporting to the audience
Different stakeholders need different levels of detail. Executives are usually looking for trends in retention, expansion, forecasted revenue, and major portfolio risks. They need a clear summary of what changed and what decisions are required.
CS leaders may need more detail on team capacity, segment performance, playbook effectiveness, and risk coverage. CSMs need account-level information that helps them decide what to do next. Avoid sending the same dashboard to every audience, as too much detail can obscure the insight each group actually needs.
Review whether the report is changing behaviour
A report is only useful if it leads to action. Track whether flagged risks are being assigned, whether interventions happen on time, and whether teams follow through on the decisions made during reporting meetings.
Reports should end with clear actions, owners, and deadlines. Over time, review whether those actions improved the underlying outcome. This helps distinguish between metrics that are interesting to monitor and metrics that genuinely support better decisions.
Refine dashboards as business priorities change
Reporting requirements should evolve with the company. A team focused on improving onboarding may initially track time-to-value and milestone completion. As the business matures, the focus may shift towards renewal forecasting, expansion, advocacy, or CSM capacity.
Review dashboards regularly and remove metrics that are no longer useful. Add new measures only when they support a clear decision or business objective. This prevents reports from becoming cluttered with legacy KPIs that nobody acts on.
Use predictive insights to identify risk earlier
AI and predictive analytics can help teams detect risk before it appears in a renewal forecast. Models can analyse changes in product usage, support activity, stakeholder engagement, and sentiment to highlight accounts that need investigation.
Predictions should not be treated as final answers. CSMs still need to review the account context and decide on the right response. The most effective reporting combines predictive signals with an explanation of what changed and a recommended next action.
Match reporting cadence to the audience
Weekly reports should focus on immediate action, such as new risks, overdue milestones, escalations, and upcoming renewals. Monthly reviews can step back to assess portfolio trends, forecast accuracy, adoption, expansion, and team workload.
Quarterly executive reporting should roll those insights into a concise view of business impact, using metrics such as GRR, NRR, churned revenue, and strategic risk. Keep definitions consistent so weekly account signals flow cleanly into monthly trends and quarterly outcomes.
Conclusion
Customer success reporting is the foundation of sustainable SaaS growth. By turning data into actionable insights, linking KPIs to business goals, and designing clear dashboards, teams can move from reactive support to proactive success management. Challenges like data isolation, time constraints, or overwhelming volumes can be solved with best practices and platforms like Velaris, which is highly rated on G2, we can centralize data and simplify reporting. When reports are precise, clear, and aligned with strategy, they become powerful tools to reduce churn, strengthen relationships, and drive long‑term growth.
To understand how Velaris can streamline the creation of your next report with its intuitive interface and comprehensive suite of tools, book a demo today.
Frequently Asked Questions
What should you do when a health score conflicts with CSM judgement?
Treat the disagreement as a reason to investigate, not automatically as proof that either side is wrong. The model may be detecting a change the CSM has missed, while the CSM may know about relationship context that has not been recorded in the system.
Document the reason for any manual override. Repeated disagreements may reveal missing data, poorly weighted signals, or inconsistent account-management practices.
How should incomplete customer data be shown in a report?
Do not present an account as healthy simply because risk data is missing. Flag incomplete records clearly and show which inputs are unavailable, such as usage, sentiment, support activity, or renewal information.
A separate data-confidence indicator can help readers distinguish between a genuinely healthy account and one where the system lacks enough evidence to assess risk.
How can reporting improve collaboration across teams?
Clear reporting builds trust by giving executives, product teams, and customer success managers a shared view of customer health and revenue impact.
Should customer success teams rely on industry benchmarks?
Benchmarks can provide context, but internal trends are usually more useful for day-to-day decisions. A retention rate may look strong against an industry average while still declining compared with the company’s previous performance.
Use external benchmarks to understand the wider market. Use historical performance, customer segments, and cohorts to decide where action is needed.
Can reporting frameworks adapt to different business models?
Yes. Whether subscription‑based SaaS, enterprise software, or hybrid models, frameworks can be tailored by adjusting KPIs and aligning with customer journey stages.
The Velaris Team
A (our) team with years of experience in Customer Success have come together to redefine CS with Velaris. One platform, limitless Success.

Velaris is an AI-native Customer Success Platform built for mid-market and enterprise B2B SaaS teams. From customer health scoring and churn prediction to onboarding automation, renewals, and expansion workflows, Velaris helps recurring revenue teams understand account health, reduce churn, and scale customer success with greater visibility and control.